CPI and SPI Explained for PMP Questions: How to Read the Numbers Before Choosing an Answer
 admino
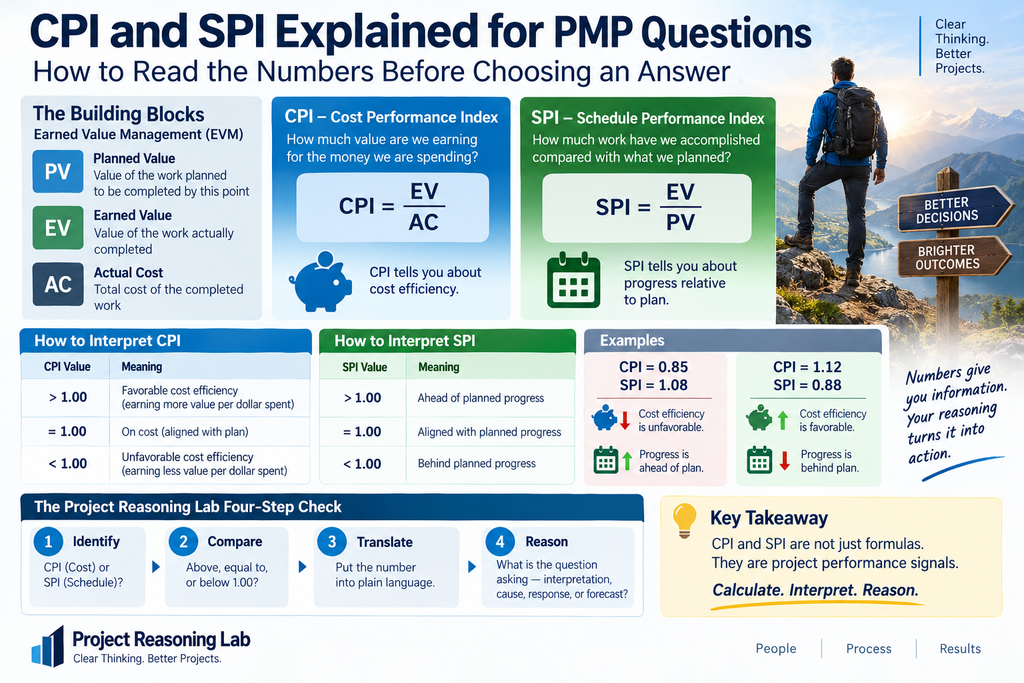
A PMP® question gives you two numbers:
CPI = 0.82
SPI = 1.07
What do they actually mean?
Many candidates memorize:
CPI = EV ÷ AC
SPI = EV ÷ PV
But the formula is only the beginning.
The real PMP skill is being able to translate the number into a project condition:
- Is cost performance favorable or unfavorable?
- Is progress ahead of or behind what was planned?
- Does the number tell us the cause?
- What should the project manager do next?
A simple starting point is:
CPI tells you about cost efficiency.
SPI tells you about schedule performance relative to planned progress.
And for both indexes, the key reference point is:
1.00
1. First, Understand EV, PV, and AC
Before using the formulas, understand the three values behind them.
Planned Value — PV
How much value did we plan to have completed by this point?
Earned Value — EV
How much planned value have we actually earned through completed work?
Actual Cost — AC
How much did the completed work actually cost?
Now the two formulas become easier to understand.
CPI
EV ÷ AC
This compares:
value earned vs. money spent
SPI
EV ÷ PV
This compares:
value earned vs. value we planned to have earned by now
Instead of memorizing letters alone, remember what is being compared.
2. CPI Measures Cost Efficiency
The Cost Performance Index is:
CPI = EV ÷ AC
Suppose:
EV = $80,000
AC = $100,000
Then:
CPI = 80,000 ÷ 100,000 = 0.80
Because CPI is below 1.00, cost performance is unfavorable.
In simple terms:
The project is earning about $0.80 of value for every $1.00 spent.
Now consider:
EV = $120,000
AC = $100,000
Then:
CPI = 1.20
The project is earning more value relative to what it is spending.
So remember:
CPI > 1.00 → favorable cost efficiency
CPI = 1.00 → cost performance aligned with plan
CPI < 1.00 → unfavorable cost efficiency
3. SPI Measures Schedule Performance
The Schedule Performance Index is:
SPI = EV ÷ PV
Suppose:
EV = $90,000
PV = $100,000
Then:
SPI = 0.90
The project has earned 90% of the value it was planned to have earned by this point.
That indicates progress is behind plan.
Now suppose:
EV = $110,000
PV = $100,000
Then:
SPI = 1.10
The project has earned more value than planned for this point in time.
So:
SPI > 1.00 → ahead of planned progress
SPI = 1.00 → aligned with planned progress
SPI < 1.00 → behind planned progress
4. The Reference Point Is 1.00
A quick way to interpret either index is:
| Index | Above 1.00 | Equal to 1.00 | Below 1.00 |
|---|---|---|---|
| CPI | Favorable cost efficiency | Cost performance aligned | Unfavorable cost efficiency |
| SPI | Ahead of planned progress | Planned progress aligned | Behind planned progress |
This simple comparison handles many PMP questions.
But do not confuse the two:
CPI = Cost
SPI = Schedule performance
5. Read CPI and SPI Together
A project can perform differently on cost and planned progress.
For example:
CPI = 0.85
SPI = 1.08
Interpret them separately.
CPI = 0.85
Below 1.00.
→ Unfavorable cost efficiency
SPI = 1.08
Above 1.00.
→ Ahead of planned progress
So the project is:
Experiencing unfavorable cost efficiency while progressing ahead of plan.
Now reverse the situation:
CPI = 1.12
SPI = 0.88
The project has:
Favorable cost efficiency but is behind planned progress.
Cost performance and planned progress do not have to move in the same direction.
Four Common Combinations
| CPI | SPI | Interpretation |
|---|---|---|
| > 1 | > 1 | Favorable cost efficiency and ahead of planned progress |
| < 1 | < 1 | Unfavorable cost efficiency and behind planned progress |
| < 1 | > 1 | Unfavorable cost efficiency but ahead of planned progress |
| > 1 | < 1 | Favorable cost efficiency but behind planned progress |
This is often more useful than memorizing the two formulas separately.
6. The Index Tells You What — Not Necessarily Why
Suppose:
CPI = 0.75
You know something important:
Cost efficiency is unfavorable.
But CPI alone does not tell you why.
Possible causes might include:
- underestimated work,
- rework,
- supplier cost increases,
- expensive resources,
- poor productivity,
- quality problems,
- unexpected complexity.
Likewise:
SPI = 0.82
tells you that progress is behind plan.
It does not automatically tell you whether the cause is:
- a dependency,
- external approval,
- equipment failure,
- resource availability,
- unclear requirements,
- technical problems.
This leads to an important Project Reasoning Lab principle:
Performance data identifies the signal. It does not automatically identify the cause.
7. Don’t Jump Straight From the Number to a Solution
Consider:
A project has a CPI of 0.78.
Two answers remain:
A. Reduce project resources immediately to lower costs.
B. Determine the cause of the unfavorable cost performance before selecting a response.
The CPI shows a cost-efficiency problem.
But it does not tell us that excessive staffing is the cause.
Reducing resources could make the project worse.
The same reasoning applies to SPI.
Suppose:
SPI = 0.82.
Should the project manager add more people immediately?
Not necessarily.
The delay may have nothing to do with staffing.
A useful reasoning sequence is:
Interpret → Investigate → Respond
Unless the scenario already tells you that the investigation has occurred.
8. Read the Numbers Before Reading the Answers
This is one of the simplest PMP habits you can develop.
Suppose the question says:
CPI = 0.91
SPI = 1.06
Before looking at the answer choices, translate them.
CPI 0.91 → unfavorable cost efficiency
SPI 1.06 → ahead of planned progress
Now you understand the project condition:
Progress is ahead of plan, while cost efficiency is unfavorable.
Only then evaluate the answer choices.
Why?
Because answer choices can subtly influence how you interpret the numbers.
Translate the data first. Then judge the options.
9. Magnitude Matters — But Don’t Invent Thresholds
A CPI of 0.99 and a CPI of 0.64 are both unfavorable, but not to the same degree.
Interpret how far the value is from 1.00 in context, and do not invent universal escalation or corrective-action thresholds unless the scenario provides them.
The same reasoning applies to SPI.
10. CPI and SPI Are Indicators, Not Complete Decisions
A project manager should not make a complex project decision using one ratio alone.
CPI and SPI may need to be considered together with:
- performance trends,
- remaining work,
- risk,
- quality,
- dependencies,
- forecasts,
- stakeholder impact,
- business priorities.
A single number can tell you that something deserves attention.
It may not tell you what the correct management response is.
That distinction matters on the PMP exam.
Performance data informs judgment. It does not replace judgment.
The Project Reasoning Lab Four-Step Check
When you see CPI or SPI in a PMP scenario, use this sequence.
1. Identify
Which index is it?
CPI → Cost
SPI → Schedule performance
2. Compare
Is it:
Above 1.00?
Equal to 1.00?
Below 1.00?
3. Translate
Put the number into plain language.
Don’t stop at:
CPI = 0.84
Translate it:
The project has unfavorable cost efficiency.
Or:
SPI = 1.05
becomes:
The project is ahead of planned progress.
4. Reason
What is the question actually asking you to do?
Is it asking you to:
- interpret performance,
- identify a problem,
- investigate the cause,
- select a response,
- forecast future performance?
Do not answer a different question merely because you know the formula.
Quick Reference
| Measure | Formula | What It Measures | > 1.00 | < 1.00 |
|---|---|---|---|---|
| CPI | EV ÷ AC | Cost efficiency | Favorable | Unfavorable |
| SPI | EV ÷ PV | Schedule performance relative to plan | Ahead of planned progress | Behind planned progress |
Remember:
CPI = Cost
SPI = Schedule performance
1.00 = Reference point
Final Takeaway
CPI and SPI are not just formulas. They are project performance signals.
CPI tells you about cost efficiency. SPI tells you about progress relative to plan.
Compare the index with 1.00, translate the result into plain language, and then determine what the scenario actually requires.
The formulas are simple:
CPI = EV ÷ AC
SPI = EV ÷ PV
But interpretation is where the real PMP reasoning begins.
Calculate. Interpret. Reason.